Trump’s Economic Approval Is 37% in Key House Districts — But the 2018 Comparison Needs Context
With the 2026 midterm elections approaching, the economy has become one of the most closely watched issues in competitive U.S. House districts.
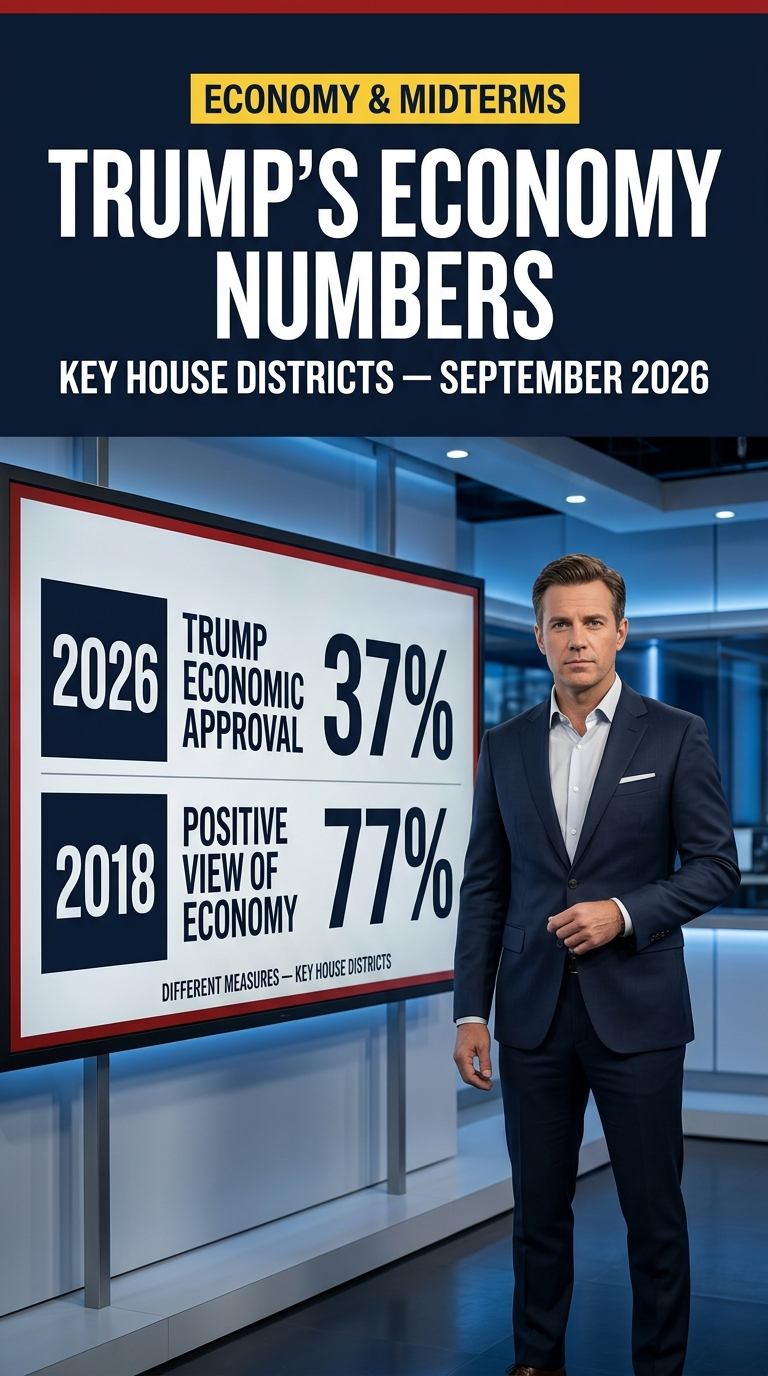
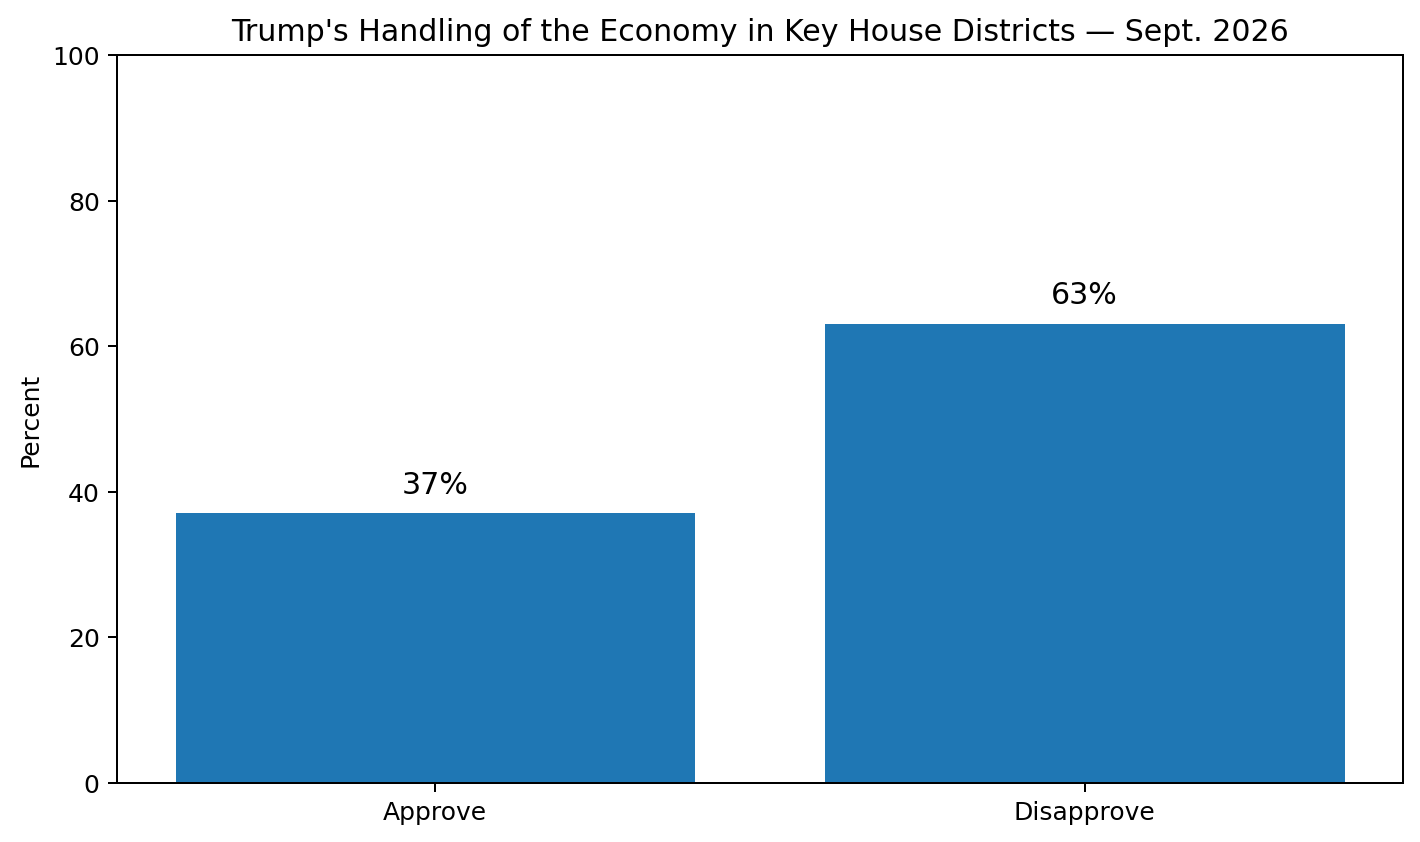
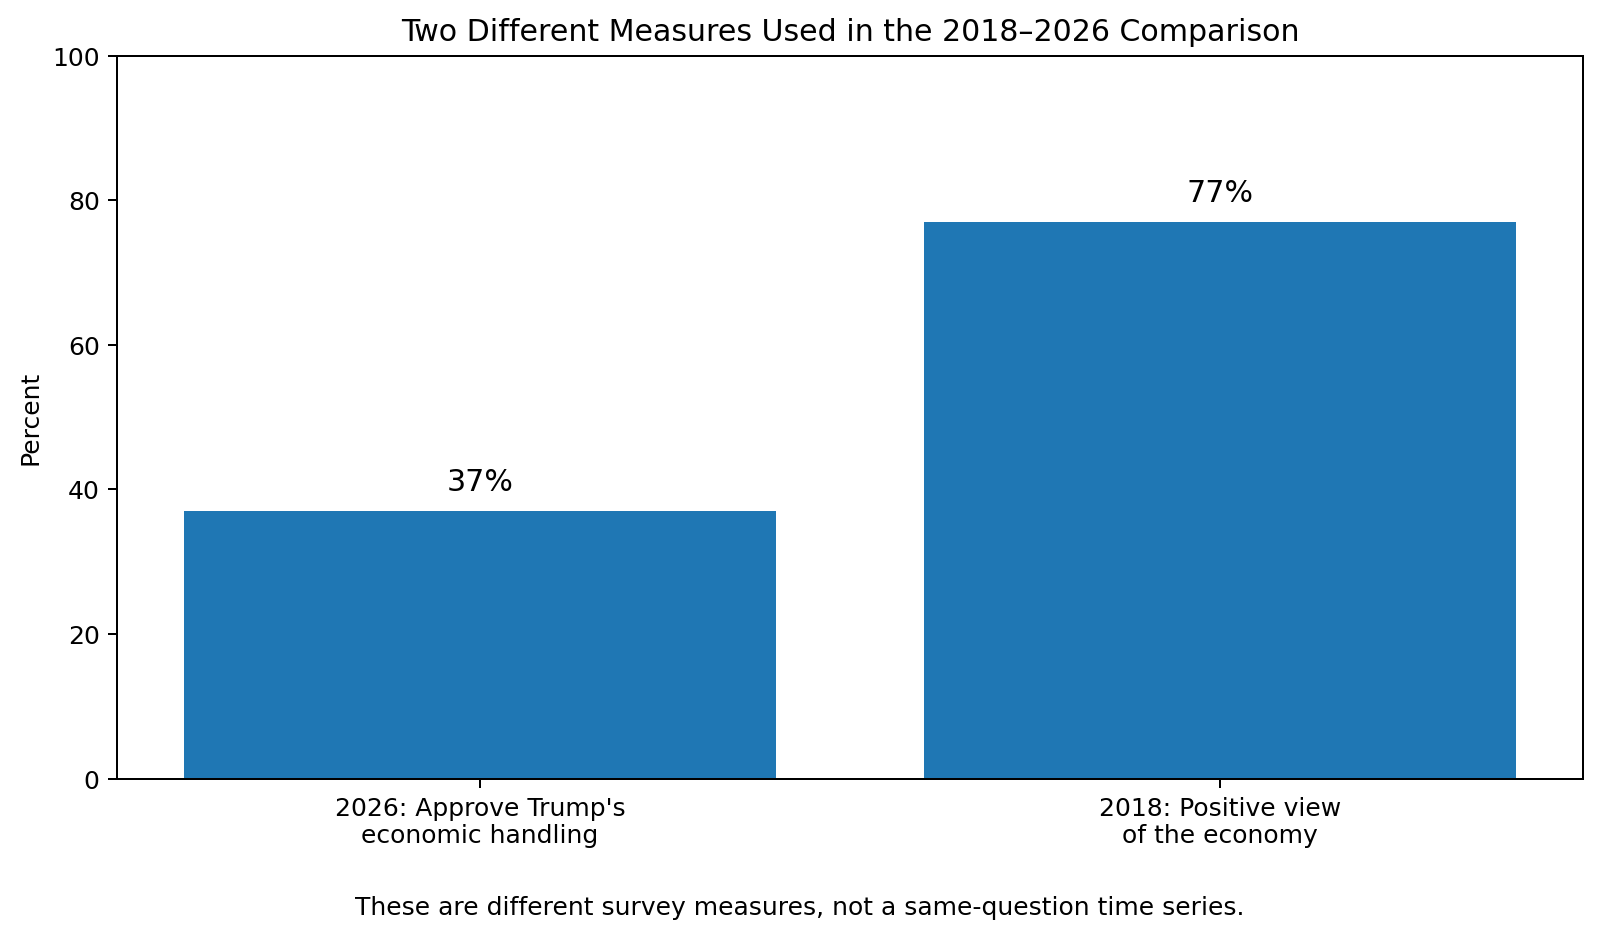
A late-September analysis put President Donald Trump’s approval for his handling of the economy at 37% in key House districts, with roughly 63% disapproving. That produces a net economic approval rating of about minus 26 points in those districts.
The figure is getting attention because economic conditions have often played an important role in midterm campaigns. But there is an important detail behind the comparison now circulating alongside it: the widely cited 77% figure from 2018 is not the same measurement.
The 37% Number Is About Trump’s Handling of the Economy
The 37% figure refers to voters in key House districts who approved of Trump’s handling of the economy in September 2026.
That is a judgment about the president’s performance on one issue. It does not mean that only 37% of voters believe every part of the U.S. economy is doing well, and it is not a direct measure of growth, jobs or inflation.
The distinction matters because public opinion about the economy can be shaped by more than headline economic statistics. Voters may consider grocery prices, gasoline, rent, mortgage rates, wages, job security and their personal financial situation at the same time.
In other words, an economy can show strength in some official data while still receiving poor marks from households that feel squeezed by prices or borrowing costs.
Why the 77% Figure From 2018 Is Different
The 2018 number measures something broader.
In September 2018, 77% of voters in that year’s key House districts were described as having a positive view of the economy. That is not the same question as asking whether voters approve of a president’s handling of the economy.
So the two numbers should not be treated as a precise 40-point decline in one identical measure.
What they can show is a broad contrast in mood. In the competitive districts highlighted in 2018, most voters viewed the economy positively. In the 2026 snapshot, most voters do not approve of Trump’s management of the economy.
That difference helps explain why the economic debate is taking up so much space in the final weeks of the midterm campaign.
Competitive House Districts Are Closely Divided
A separate September poll of 1,052 likely voters across 37 competitive House districts found a closely divided congressional electorate.
In that survey, 49% said they would support the Democratic candidate on the generic congressional ballot and 47% said they would support the Republican candidate. The margin of error was about three percentage points.
Those districts were not representative of the entire country. They were specifically selected because they were rated as competitive, including districts classified as Toss Up, Lean Republican or Lean Democrat.
The same group of districts had supported Trump by an average of about five percentage points in the 2024 presidential election.
That makes the polling useful for understanding the environment in closely contested House races, but it should not be read as a national vote forecast or as a result for every individual district.
The Economic Data Itself Is Mixed
The public mood is only one part of the story. The latest government data show an economy with both areas of strength and clear pressure points.
Consumer prices rose 3.4% over the 12 months ending in August 2026. Gasoline prices increased sharply during the month and accounted for more than one-third of the monthly increase in the overall consumer price index.
At the same time, the labor market remained comparatively resilient. Employers added 162,000 jobs in August, while the unemployment rate held at 4.1%.
Retail spending also showed strength. August retail sales rose 1.2%, indicating that consumers were still spending even as inflation and higher borrowing costs remained major concerns.
Those figures help explain why the economy can look different depending on which indicator a voter is watching.

Strong Spending Does Not Automatically Mean Strong Sentiment
Household sentiment has been much weaker than some of the spending and employment numbers.
A late-September consumer survey showed sentiment falling to a four-month low, with households increasingly concerned about inflation and their personal finances.
That gap between activity and confidence is important.
A consumer can continue buying groceries, paying for fuel or spending on necessary services while still believing that the economy is moving in the wrong direction for their family. Spending is not the same thing as satisfaction.
Higher prices also build on earlier increases. Even when the rate of inflation slows, that does not mean prices return to where they were several years earlier.
For many voters, that cumulative effect is more visible than a quarterly growth rate or a strong month of retail sales.
National Polls Also Show Economic Frustration
The pattern is not limited to competitive House districts.
Recent national surveys have also shown weak ratings for Trump on the economy and cost of living, although the exact percentages vary by poll, population and question wording.
That variation is another reason individual numbers should be read carefully.
A poll of all U.S. adults is not the same as a poll of registered voters. A national sample is not the same as a sample drawn only from competitive congressional districts. And asking whether the economy is “good” is not the same as asking whether the president is handling it well.
Those differences can produce noticeably different percentages without any of the polls necessarily contradicting one another.
Why the Midterm Debate Is Focusing on Costs
For both parties, the economic argument has increasingly centered on everyday costs rather than a single headline indicator.
The Trump administration has pointed to job creation, business investment, consumer spending and other measures as evidence of economic resilience.
Critics have focused on inflation, energy costs, housing affordability and the pressure high interest rates place on families financing homes, cars and credit-card balances.
Both sets of facts can exist at the same time.
The political question is how voters weigh them when they think about their own finances and decide what matters most in a congressional election.
That question cannot be answered by one approval rating alone.
What to Watch Next
Several new data releases will arrive before voters cast ballots in November.
The September jobs report is scheduled for early October, followed later in the month by September inflation data. Those releases will provide a fresher look at hiring, unemployment and price pressures.
Additional polling will also show whether views in competitive House districts are changing as campaigns intensify.
The most important point about the current 37% figure is therefore not that it guarantees any particular political outcome.
It shows that Trump’s handling of the economy is receiving weak marks among voters in many of the districts being watched most closely.
And the 77% comparison from 2018 adds useful historical context only when one important caveat is kept in view: the two numbers are measuring different things.
That distinction may be less dramatic than a simple side-by-side graphic, but it gives a much clearer picture of what the polling actually says.
Comments (0)
Loading comments...
May You Like

OBAMA STUNS ON INSTAGRAM: MESSAGE MARKING 34-YEAR MILESTONE SPARKS A BUZZ

South Korea–Ukraine Rift Deepens Over North Korean POW Transfer as PURL Draws New Scrutiny

Obama Steps Back Into the Political Spotlight as Democrats Target Trump’s Senate Majority